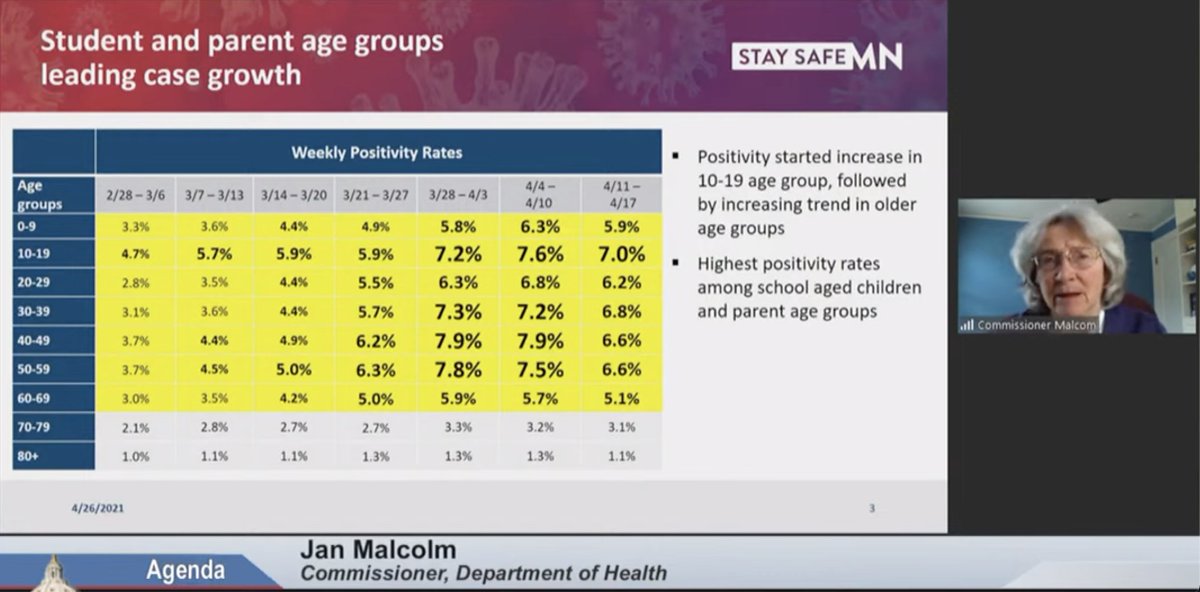
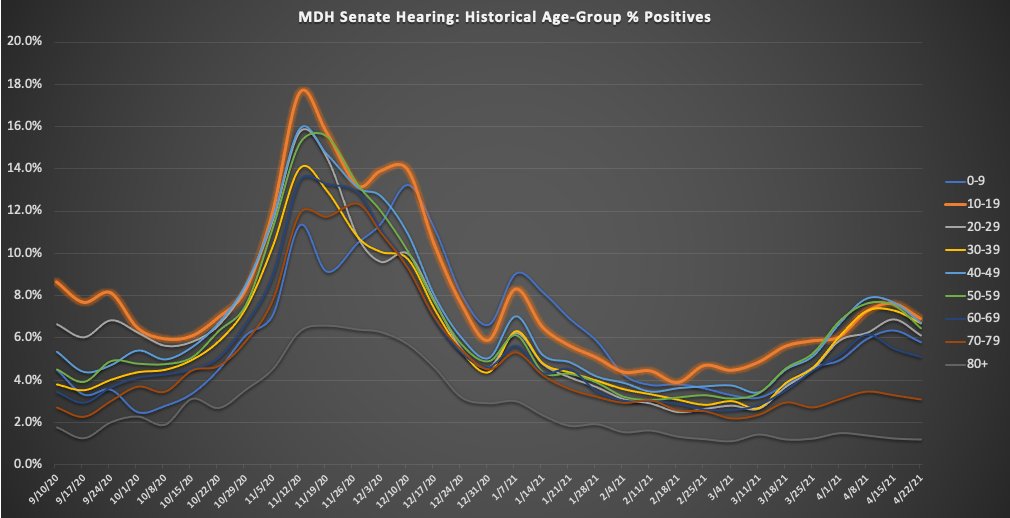
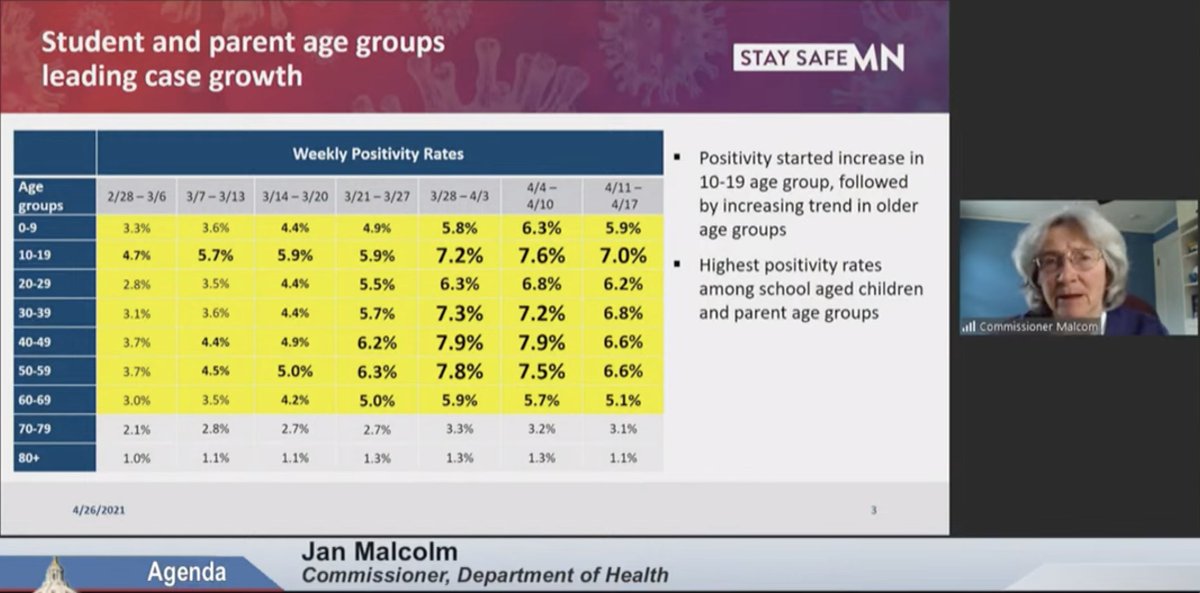
We love it when MDH shares metrics! lets look at a view of these % Positive Metrics back to Sept. 2020. See that peak in 10-19 when KIDS WEREN& #39;T IN SCHOOL!
I guess @MDHCommMalcolm just "forgot" to mention that...
... wait, there& #39;s more!
I guess @MDHCommMalcolm just "forgot" to mention that...
... wait, there& #39;s more!
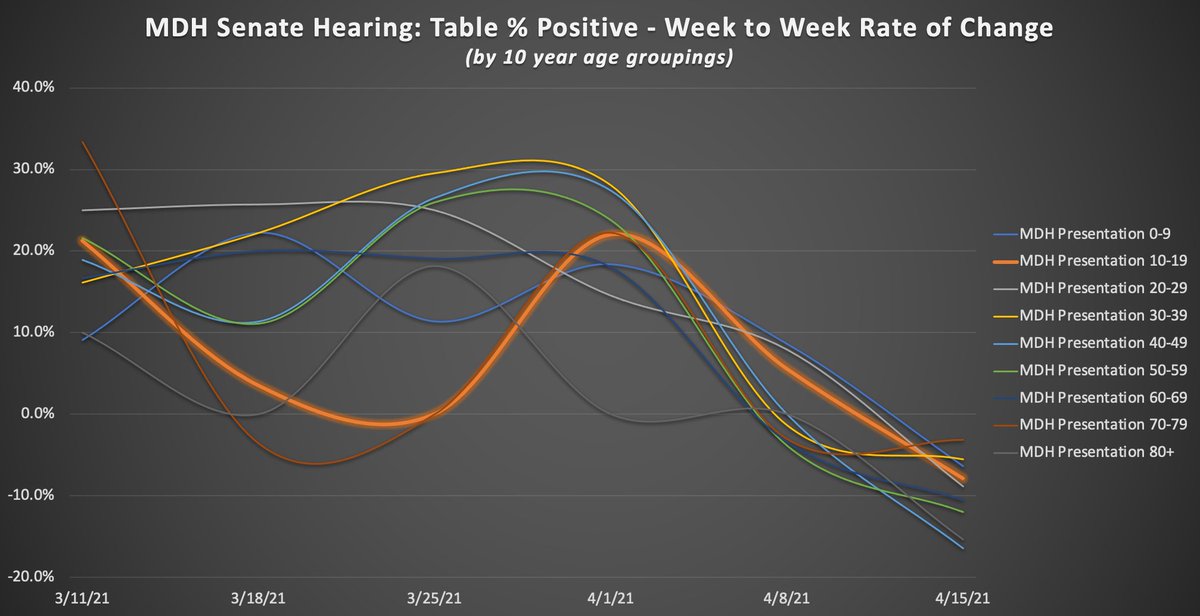
The rate of change in % Positive is valuable to show what they call the "virulence" or "aggressiveness" of the "outbreak. Clearly the 10-14 age group rate of change would be higher than all other age groups?
Damn, that doesn& #39;t hold either!
This is ALL FROM MDH DATA!
Damn, that doesn& #39;t hold either!
This is ALL FROM MDH DATA!
So lets look at it without the big scary large font indication that 10-19 year olds are killing everyone else.
Again, the 40-59& #39;s are right up there with the 10-19& #39;s as a percent positive ranking? Hmm..
Again, the 40-59& #39;s are right up there with the 10-19& #39;s as a percent positive ranking? Hmm..
One more fun MDH "trick", the dates that they are using for this analysis are different from the dates they use in their Weekly Rpt, so there is no way to truly tie the tests by age group to the cases by age group. Keep using metrics that the public can& #39;t access @MDHCommMalcolm

 Read on Twitter