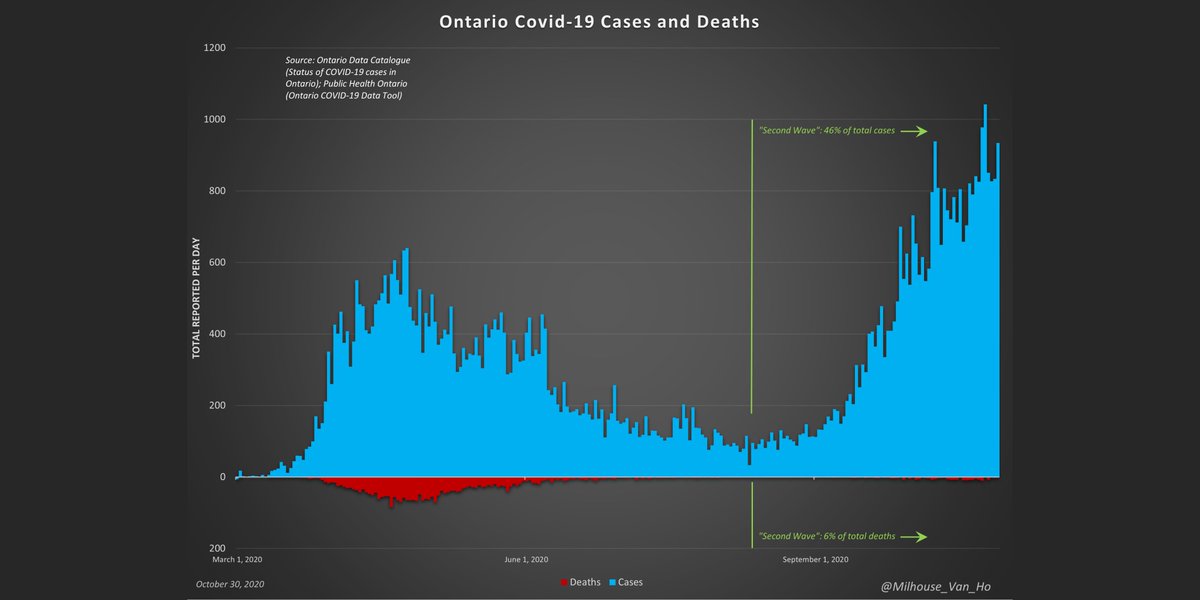
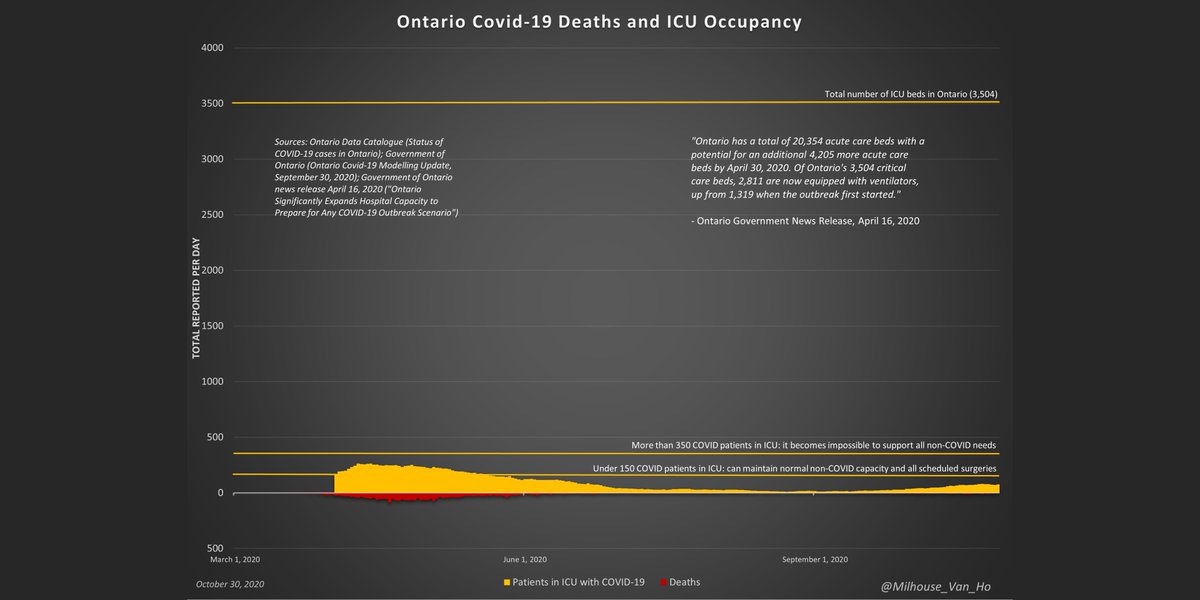
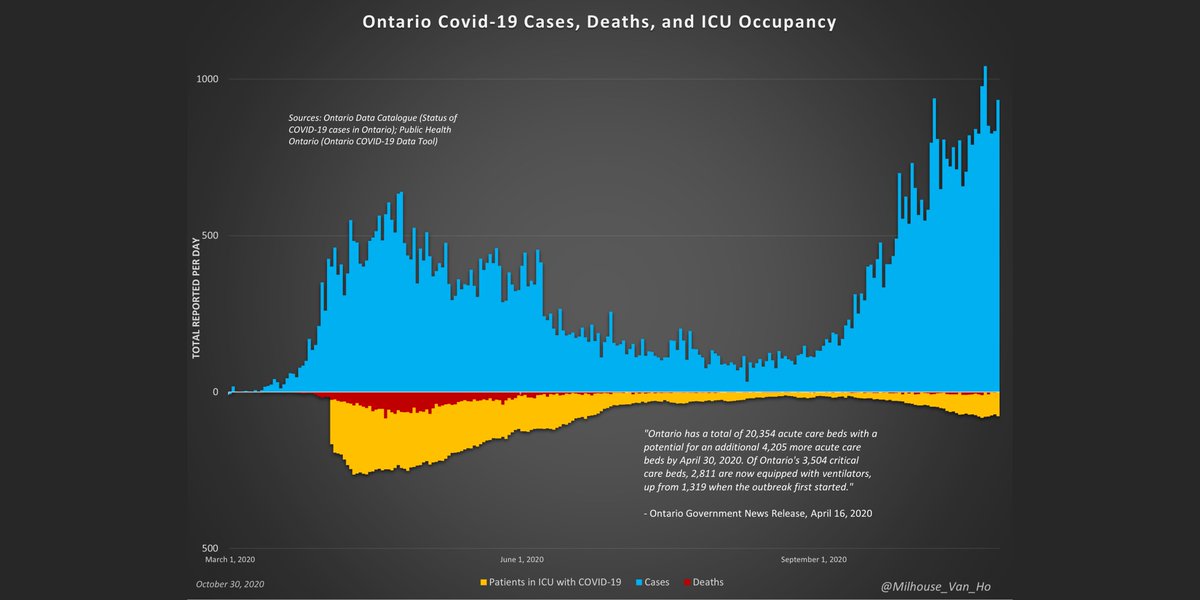
October 30 – Ontario daily update
Data is 100% public and official, and fully cited.
#COVID19Canada #COVID19Ontario
Data is 100% public and official, and fully cited.
#COVID19Canada #COVID19Ontario
Ontario (population: 14,745,040):
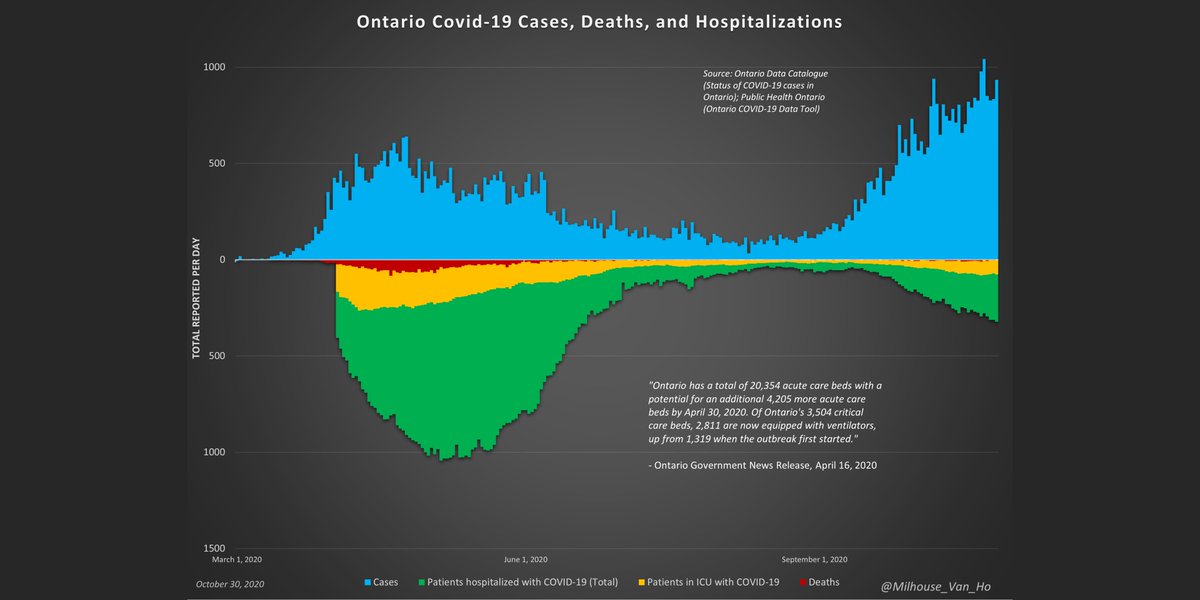
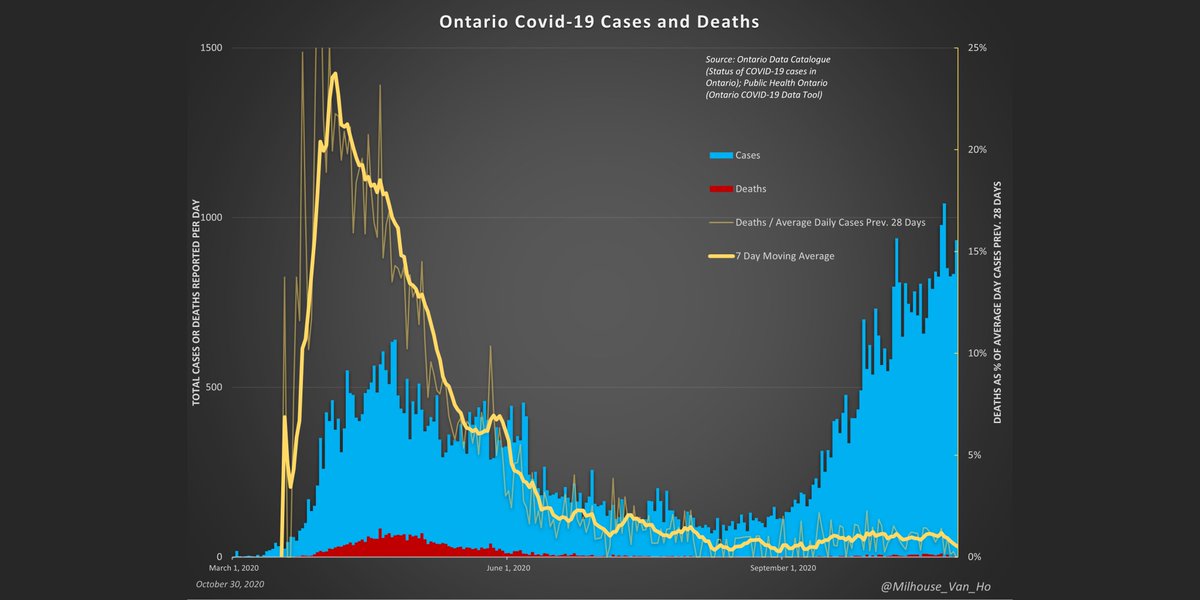
Total deaths by/with covid-19: 3,118 (211 deaths per every million people in ON or 0.02%)
38.8% of Canadian population but 31.0% of Canada deaths by/with covid-19
Total deaths by/with covid-19: 3,118 (211 deaths per every million people in ON or 0.02%)
38.8% of Canadian population but 31.0% of Canada deaths by/with covid-19
The two most important metrics to watch: deaths and ICU occupancy.
Ontario now reports:
- 77 in ICU
- 52 in ICU on a ventilator
Ontario now reports:
- 77 in ICU
- 52 in ICU on a ventilator
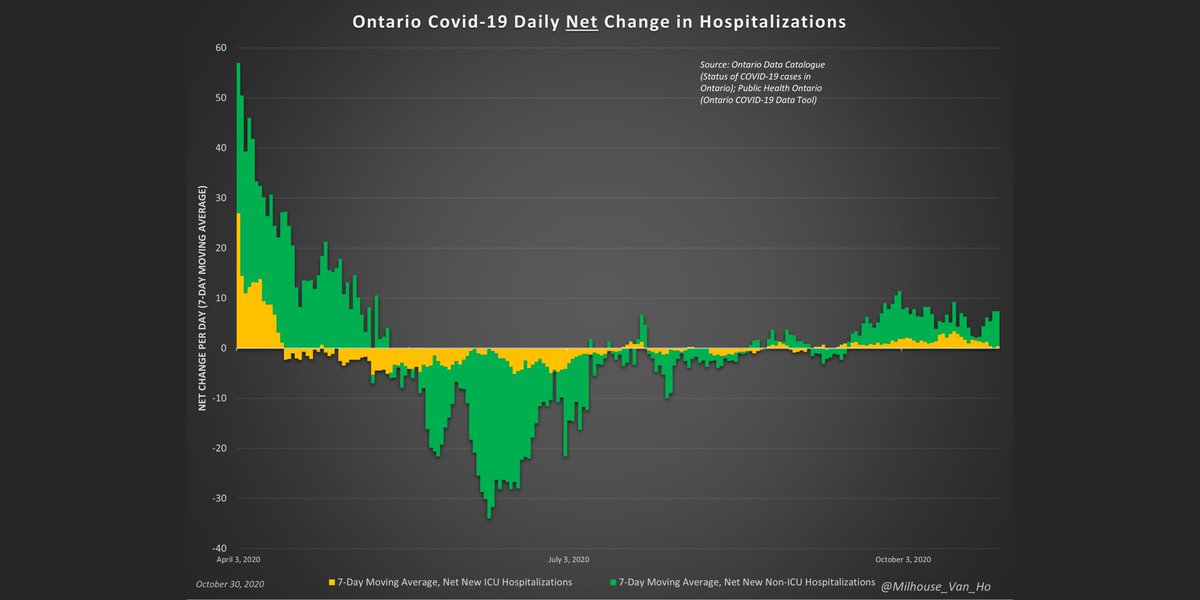
As data on daily new hospitalizations is not publicly available, this is the average daily net change in hospitalizations (ICU and non-ICU).
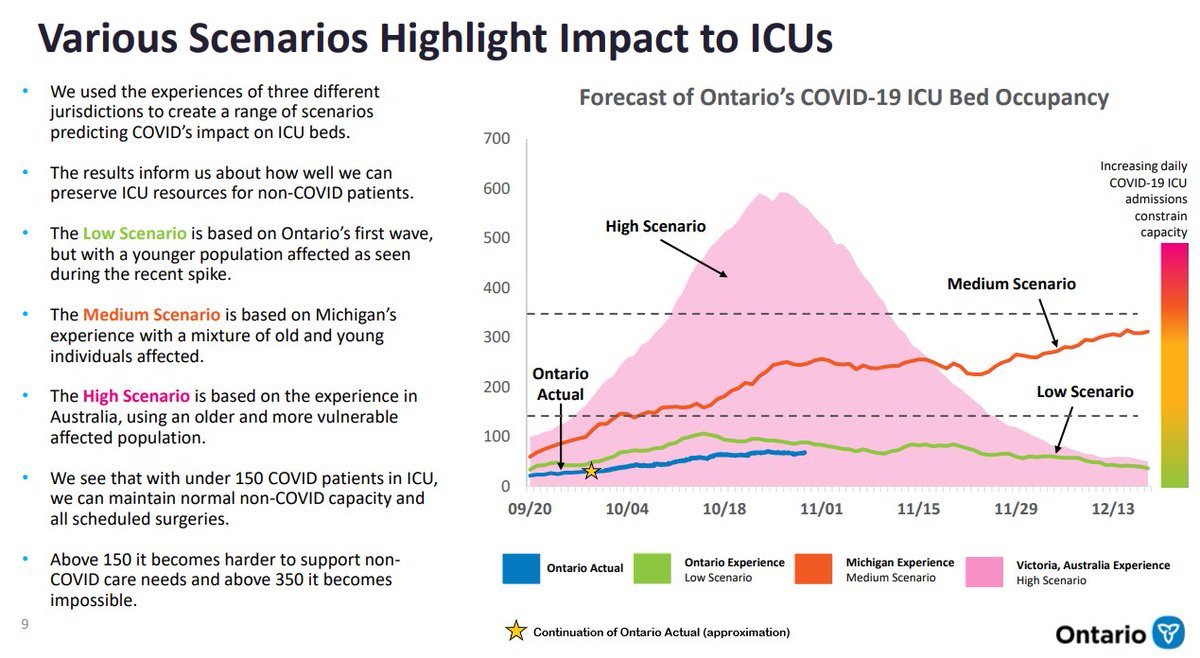
Here are the official Ontario ICU models for the “second wave.”
The Ontario Actual line has been extended here (see blue line to right of the star icon) to show progress since the models were released.
The Ontario Actual line has been extended here (see blue line to right of the star icon) to show progress since the models were released.
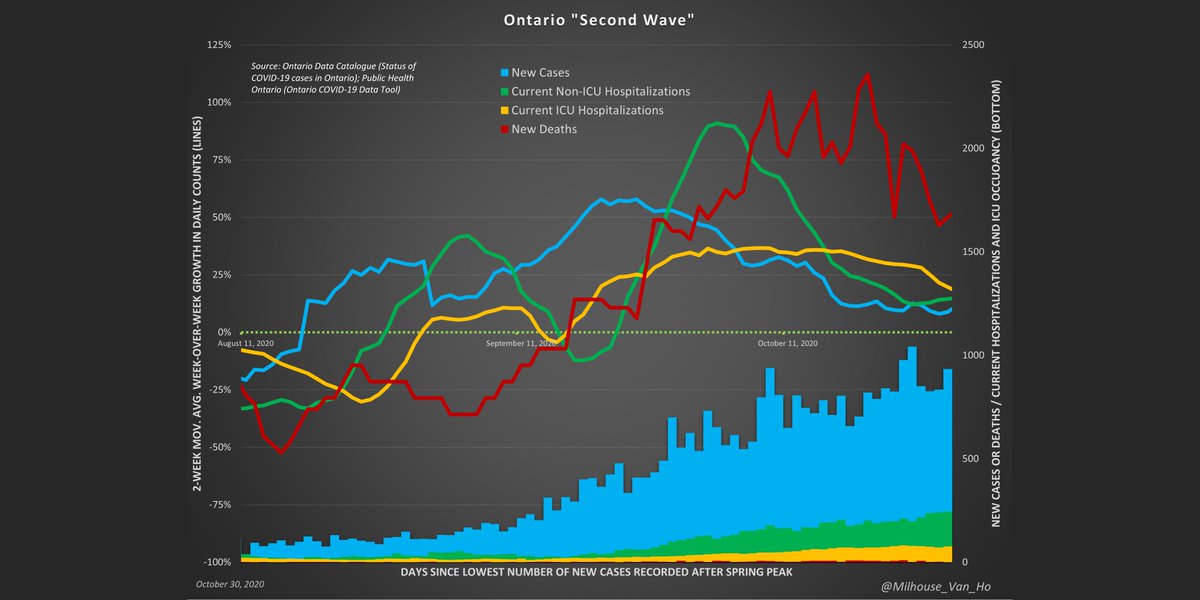
Ontario “Second Wave”:
- Growth is not exponential
- May be able to declare a peak when average week-over-week growth reaches zero
- Growth is not exponential
- May be able to declare a peak when average week-over-week growth reaches zero
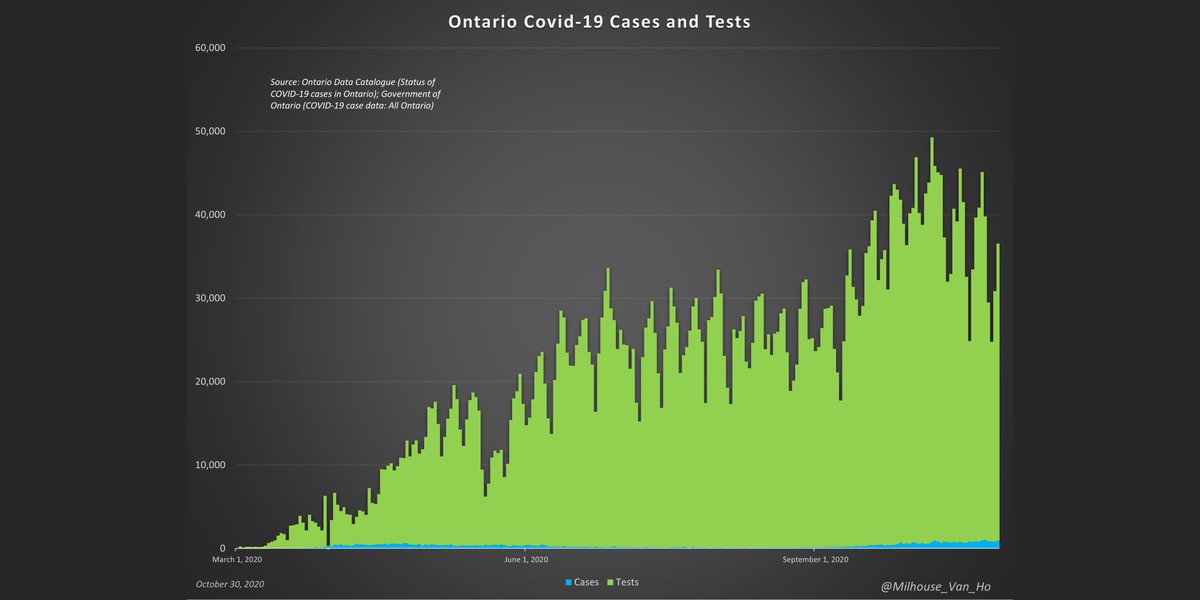
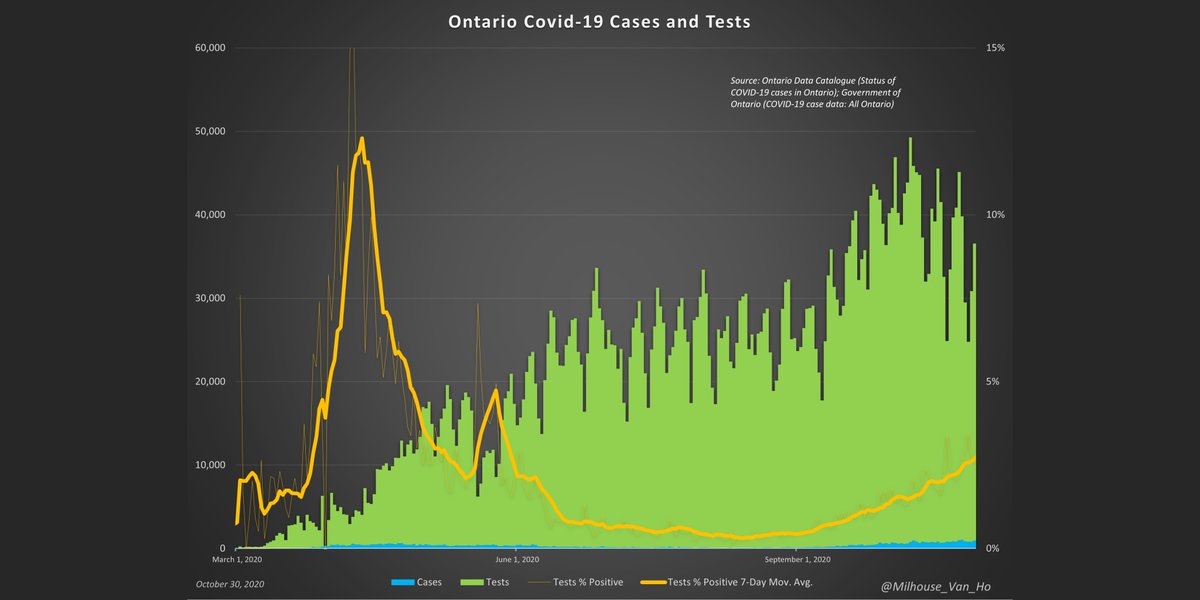
The Ontario government& #39;s level of testing and testing criteria have likely affected the number of cases (positive test results).
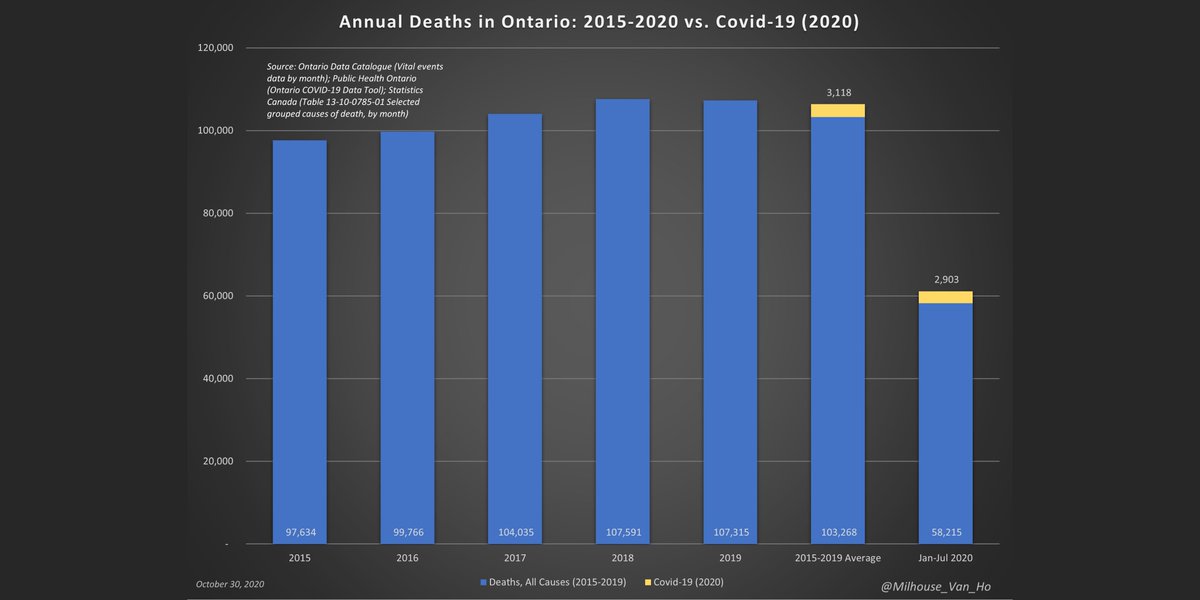
Deaths in Ontario, 2015-19, plus all deaths in 2020, Jan-July.
(n.b. Based on 2020 YTD data for Covid-19 - figures to be revised upward as needed.)
(n.b. Based on 2020 YTD data for Covid-19 - figures to be revised upward as needed.)
This is what 2020 might look like in Ontario month-to-month if:
1. All-cause deaths (excl. Covid-19) are in line with 2017-19 averages
2. All Covid-19 deaths are single-cause excess deaths
(n.b. Based on 2020 YTD data for Covid-19 - figures to be revised upward as needed.)
1. All-cause deaths (excl. Covid-19) are in line with 2017-19 averages
2. All Covid-19 deaths are single-cause excess deaths
(n.b. Based on 2020 YTD data for Covid-19 - figures to be revised upward as needed.)
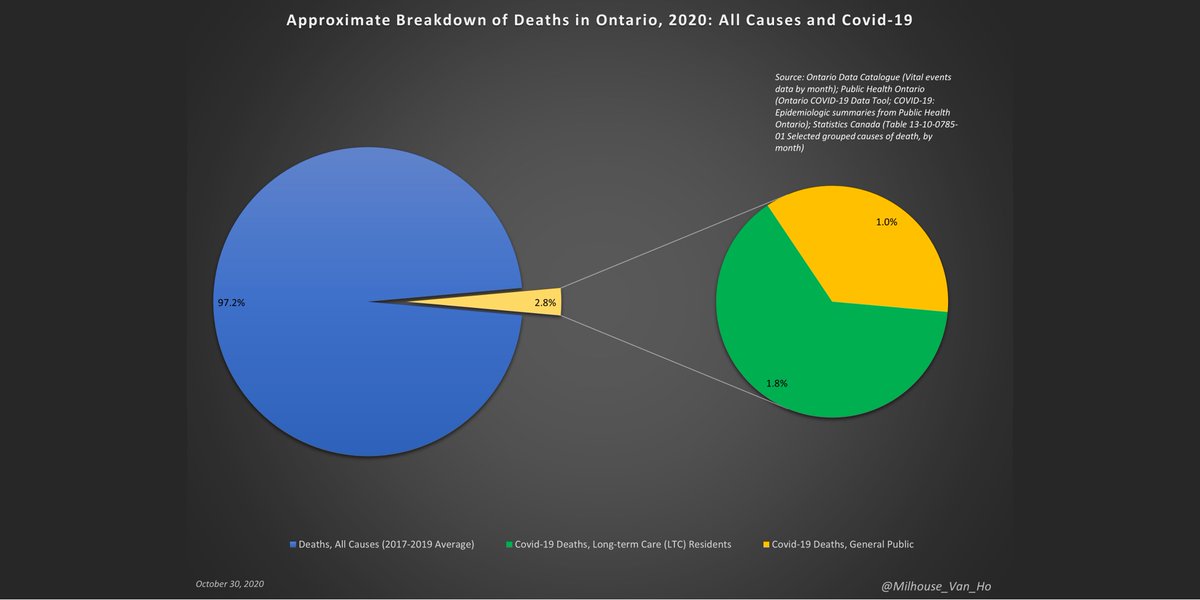
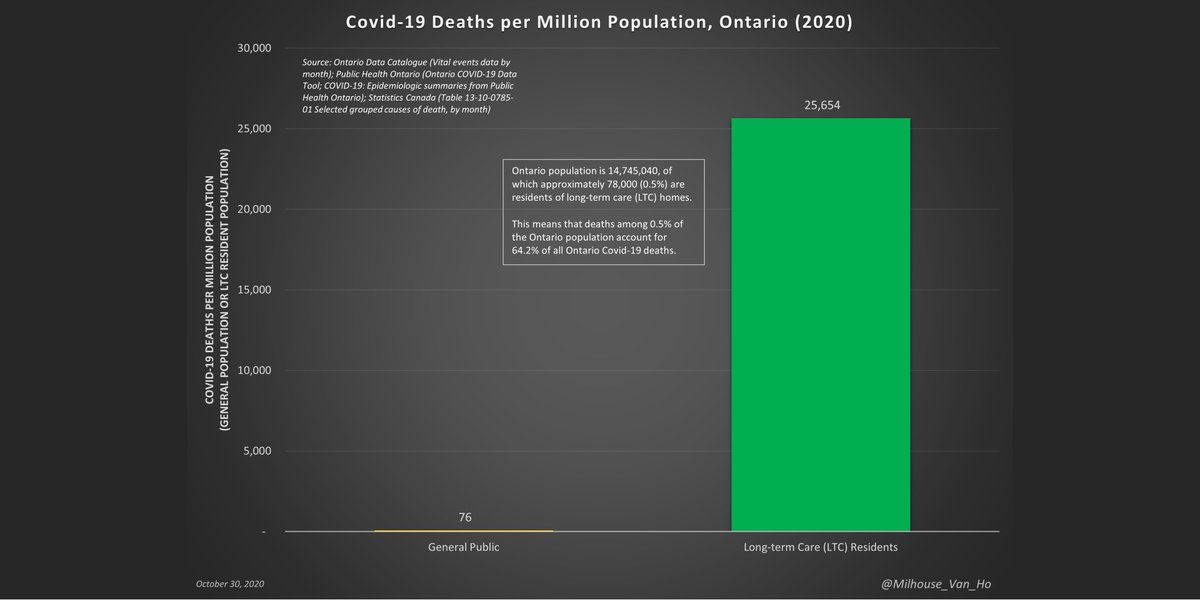
Covid-19 has been a crisis in Ontario& #39;s long-term care (LTC) system vs. among the general public.
(n.b. Based on 2020 YTD data for Covid-19 - figures to be revised upward as needed.)
(n.b. Based on 2020 YTD data for Covid-19 - figures to be revised upward as needed.)

 Read on Twitter