#TradeSetups
For a while now I& #39;ve been meaning to do a thread on one of my favorite setups
It occurs across all timeframes and is easy to spot
So enough said, lets have a look what I& #39;m talking about
1/10
For a while now I& #39;ve been meaning to do a thread on one of my favorite setups
It occurs across all timeframes and is easy to spot
So enough said, lets have a look what I& #39;m talking about
1/10
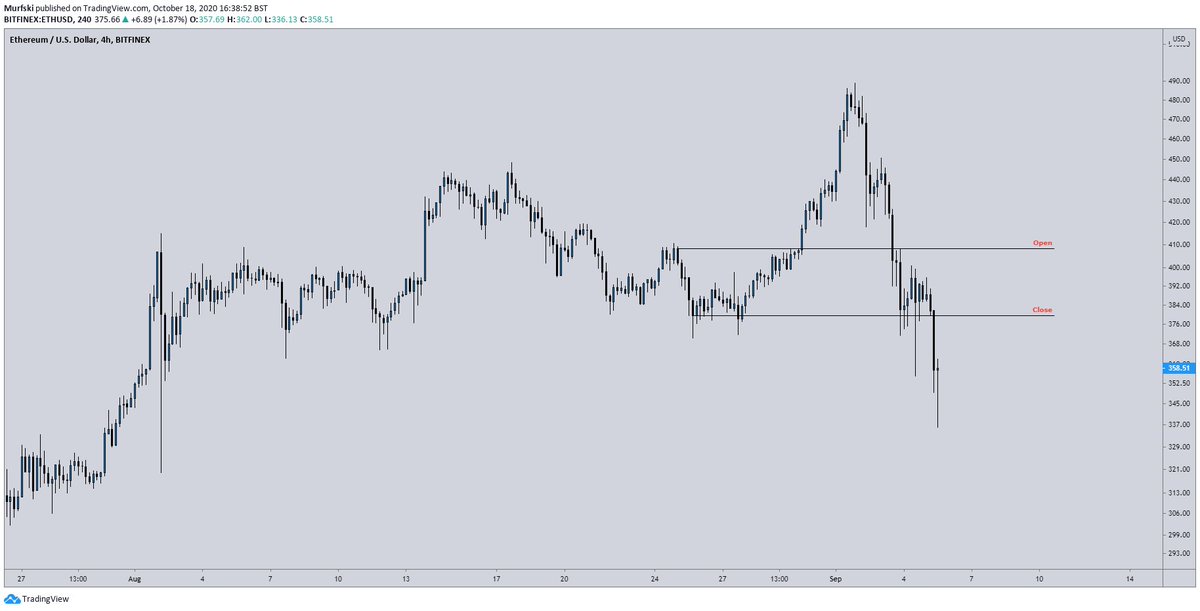
So within the chart we see a clear uptrend on Ethereum, comprising Higher Lows and Higher Highs
At the beginning of September 2020 an impulsive sell off commences, which in turn violates the previous Lower High
This is referred to as a Market Structure Break
2/10
At the beginning of September 2020 an impulsive sell off commences, which in turn violates the previous Lower High
This is referred to as a Market Structure Break
2/10
Now the theory here is that, following a Market Structure Break, price usually returns o the area at which the break occurred
Our interest is in the last group of down candles which preceded the local high. Specifically, the range spanning from the open to the close
3/10
Our interest is in the last group of down candles which preceded the local high. Specifically, the range spanning from the open to the close
3/10
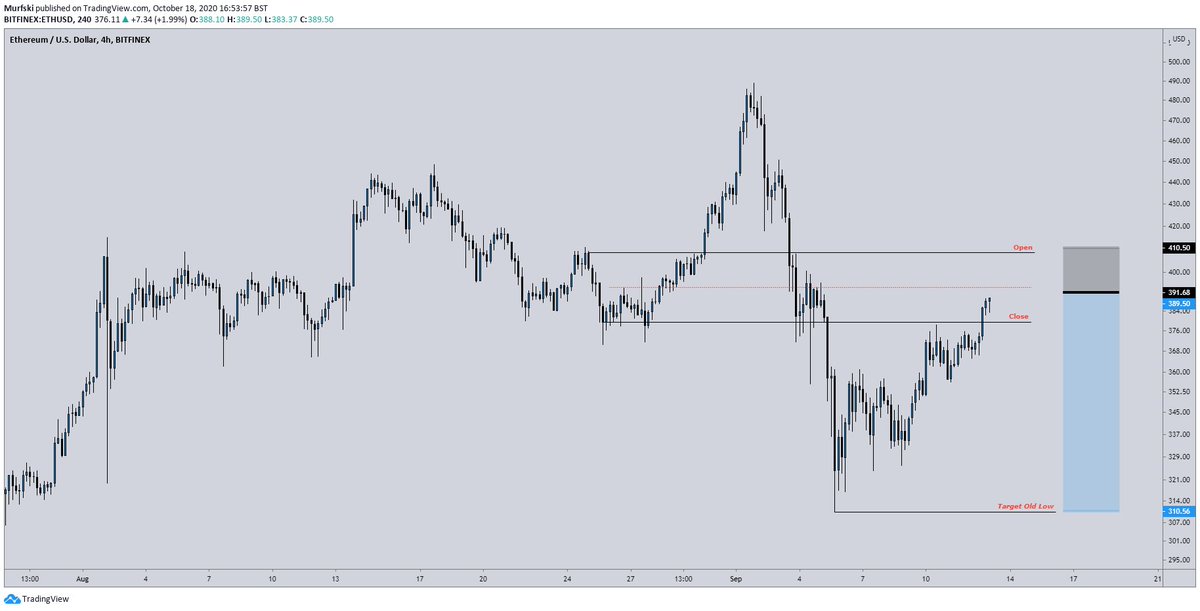
Next we must draw our range using the Fibonacci tool to determine the Equilibrium (EQ), i.e. the halfway point
The data points we& #39;re using are the open and close of the same group of candles
Open = Range High
Close = Range Low
EQ = Dotted Line
4/10
The data points we& #39;re using are the open and close of the same group of candles
Open = Range High
Close = Range Low
EQ = Dotted Line
4/10
If our thesis is correct, we can expect price to return to our range before continuation down
The entry and exits can be determined by your own tolerance to risk, however, for this example we& #39;re looking to enter a short below the EQ, with our stop loss above the close
5/10
The entry and exits can be determined by your own tolerance to risk, however, for this example we& #39;re looking to enter a short below the EQ, with our stop loss above the close
5/10
As we can see, price rallies back into our range
Set your short order just below the EQ and your stop loss above the range high
The target for our trade is the previous low
6/10
Set your short order just below the EQ and your stop loss above the range high
The target for our trade is the previous low
6/10
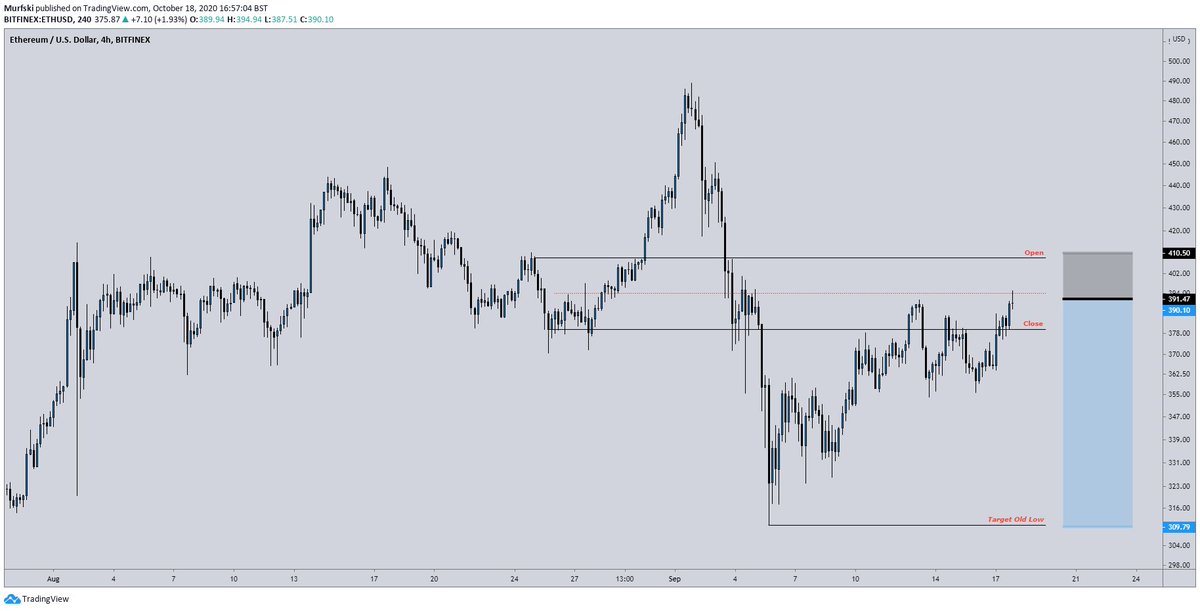
Something to watch out for with this trade
If we see price consolidate just below the EQ, it is usually a bad sign and will lead to the highs of the range being swept
Look to either reduce risk or exit your position if you see signs of this happening
7/10
If we see price consolidate just below the EQ, it is usually a bad sign and will lead to the highs of the range being swept
Look to either reduce risk or exit your position if you see signs of this happening
7/10
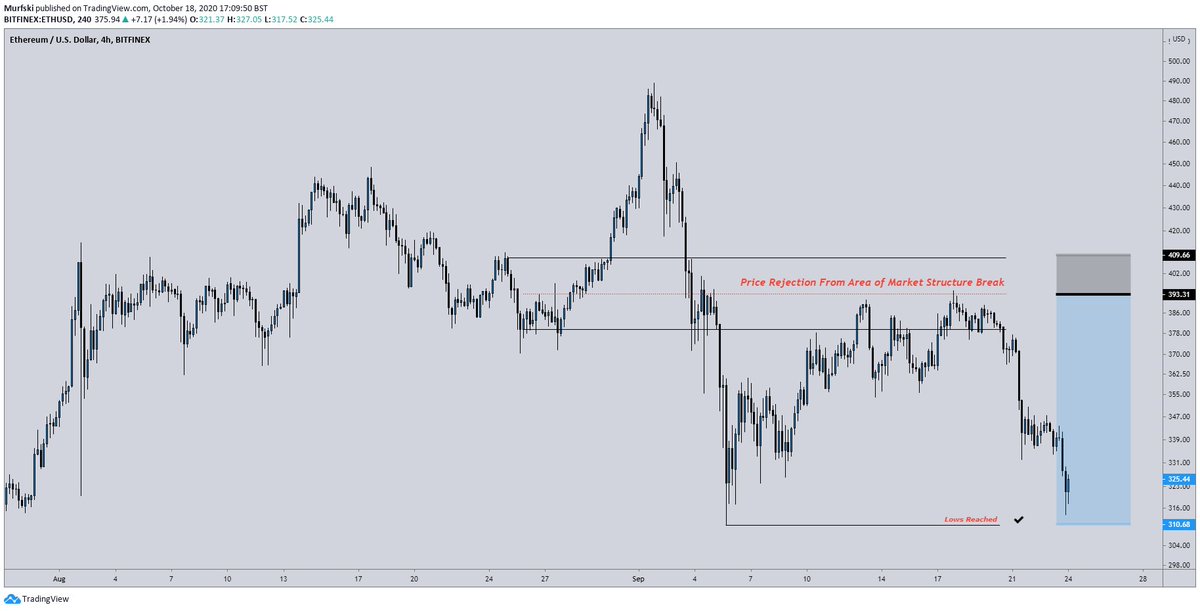
And boom, we see price head back towards the previous low
Now I recommend taking profits as the trade progresses so that you can manage your risk correctly, however, that& #39;s outside the scope of this thread
Trade completed!
8/10
Now I recommend taking profits as the trade progresses so that you can manage your risk correctly, however, that& #39;s outside the scope of this thread
Trade completed!
8/10
So in summary:
- Wait for a Market Structure Break to occur
- Draw out a range based on the cluster of down/up candles before the last high/low
- Wait for price to return to your range
- Enter your position utilizing the data points mentioned
- Target the old high/low
9/10
- Wait for a Market Structure Break to occur
- Draw out a range based on the cluster of down/up candles before the last high/low
- Wait for price to return to your range
- Enter your position utilizing the data points mentioned
- Target the old high/low
9/10
I hope this thread was helpful to you
If there are any further questions, my DM& #39;s are open
Enjoy your Sunday people!
10/10
If there are any further questions, my DM& #39;s are open
Enjoy your Sunday people!
10/10

 Read on Twitter


