1/ Interesting series of price charts (~1950-2015)
a. higher education costs increased 6x
b. lower education costs inceased 5x
c. professional services (legal, accounting, and healthcare) increased 3x
d. home appliance prices decreased by 1/3
e. vehicle prices decreased by 1/2
a. higher education costs increased 6x
b. lower education costs inceased 5x
c. professional services (legal, accounting, and healthcare) increased 3x
d. home appliance prices decreased by 1/3
e. vehicle prices decreased by 1/2
2/ Higher Education:
Figure 4: From 1980-2015 the price of private & public college increased >2x
Figure 5: Tuition growth > Expenditures growth
Figure 6: From 2000-2015, student share of costs increased from 50% to ~75%
Figure 4: From 1980-2015 the price of private & public college increased >2x
Figure 5: Tuition growth > Expenditures growth
Figure 6: From 2000-2015, student share of costs increased from 50% to ~75%
3/ Lower Education:
Figure 3: "costs have been increasing without any increase in scores...no metric of school quality shows
any improvement to justify a cost increase of more than 5x"
Figure 7: Adult literacy surveys indicate education quality is not increasing
Figure 3: "costs have been increasing without any increase in scores...no metric of school quality shows
any improvement to justify a cost increase of more than 5x"
Figure 7: Adult literacy surveys indicate education quality is not increasing
4/ Figure 9:"Even as costs have increased, enrollment has been increasing both in total and as a share of recent high school completers"
Figure 11:"although expenditures have increased, the share of expenditures devoted to instructional staff has been flat over 65 years"
Figure 11:"although expenditures have increased, the share of expenditures devoted to instructional staff has been flat over 65 years"
5/ Figure 12: Instructional expenditures per teacher increased from $33.9K to $88.6K (~2.6x) from 1950 to 2013.
"90 percent of instructional expenditures are for teacher salary and benefits."
"90 percent of instructional expenditures are for teacher salary and benefits."
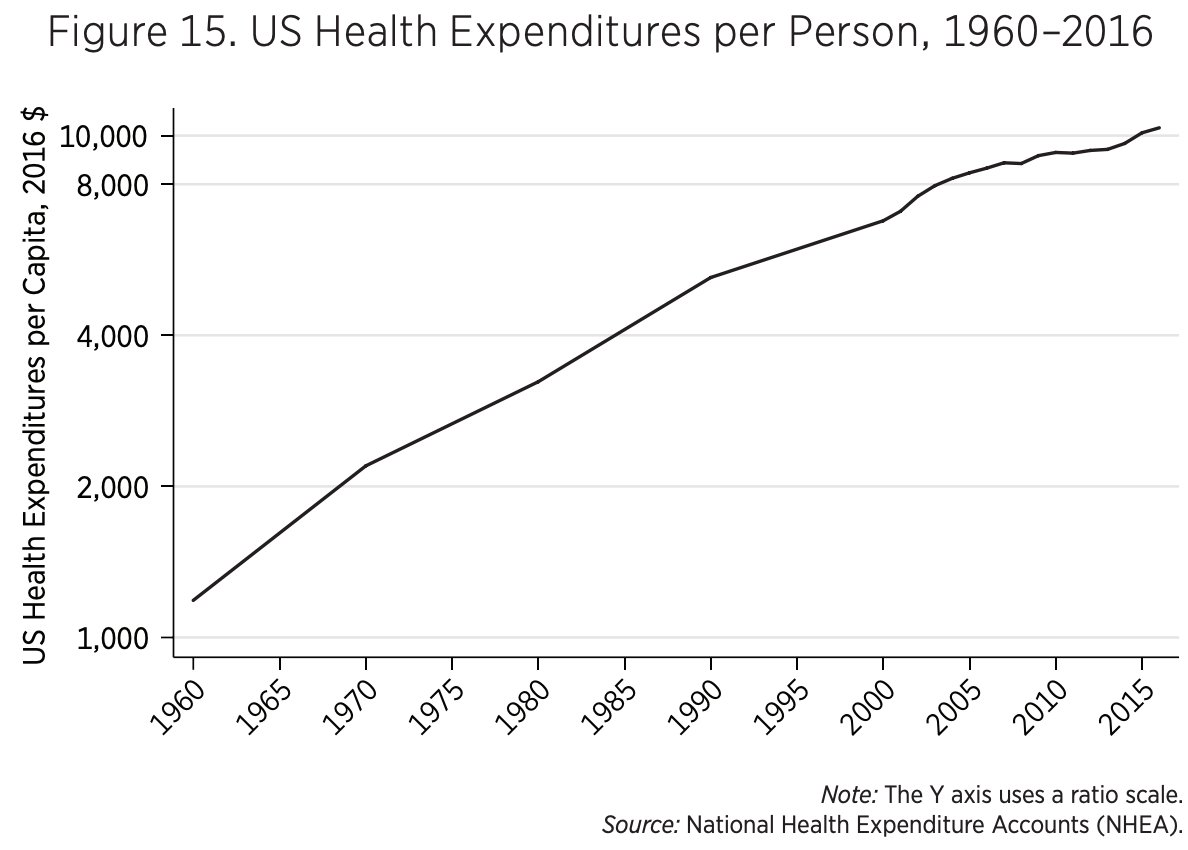
6/ Figure 15: US health expense per person increased from $1.1K to $10.4K from 1960-2016 or ~9x.
Figure 17: "International comparisons suggest that the United States might have excess costs." The United States...spends more on healthcare per capita than any other country.
Figure 17: "International comparisons suggest that the United States might have excess costs." The United States...spends more on healthcare per capita than any other country.
7/ Figure 19 & 20: Since 1960, physician income increased 3x and the number of physicians increased 2x, thus total cost increased 6x.
"By comparison, barbers and bus drivers have seen essentially no increase in real incomes."
"By comparison, barbers and bus drivers have seen essentially no increase in real incomes."
8/ Figure 25: "The productivity of manufacturing relative to services grew by a factor of six between 1950 and 2010."
Source: https://www.mercatus.org/system/files/helland-tabarrok_why-are-the-prices-so-damn-high_v2.pdf">https://www.mercatus.org/system/fi...

 Read on Twitter


